
Why explaining a diagram aloud really helps you learn it
By Rive News / Research desk | Rive News / Published October 28, 2026 at 9:00 AM PKT
Key takeaways
- Diagrams show relationships at a glance, but silent looking lets you skip the causal links.
- Explaining aloud forces you to state each link in words, which exposes gaps silent reading hides.
- In one experiment, diagram learners who self-explained beat text learners on post-tests.
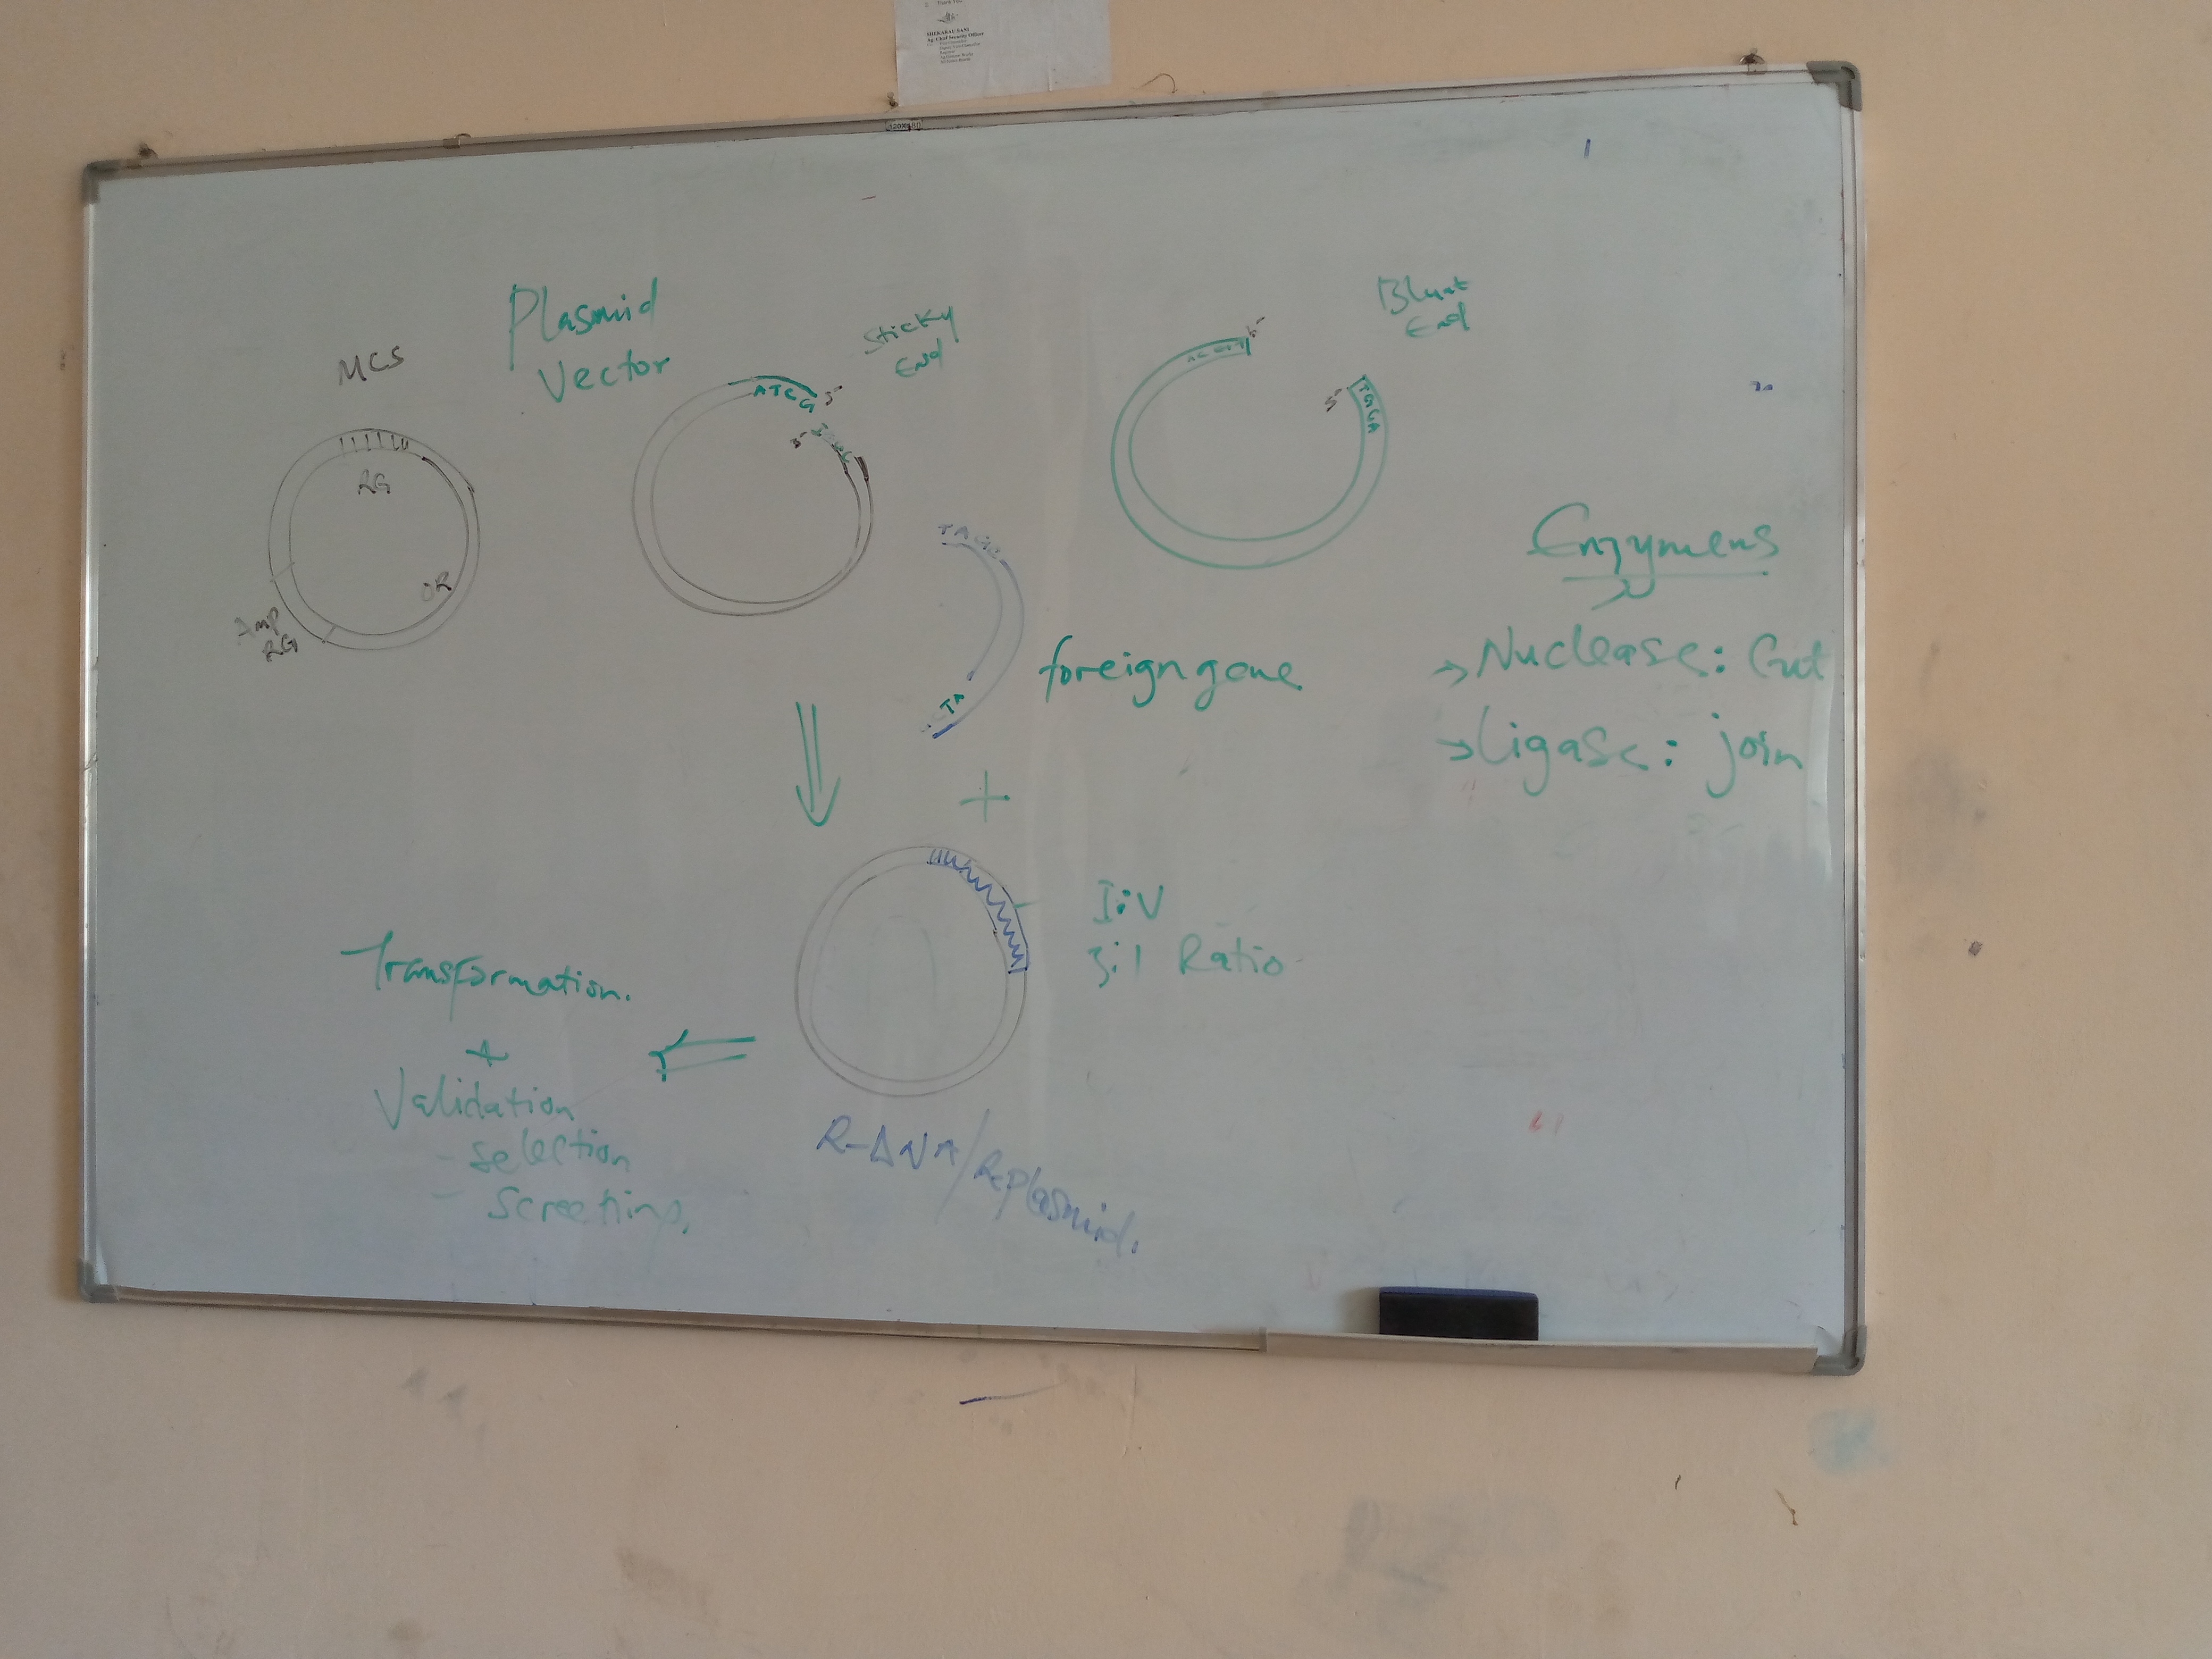
[A blank whiteboard stands ready for a diagram to be drawn and explained.] Photograph: a whiteboard
Image Credits: Wikimedia Commons
A diagram can feel understood in seconds. You look at the arrows, the boxes, and the labels, and the whole system seems clear. Then someone asks you to explain it, and the clarity evaporates halfway through the second arrow.
That gap is the reason explaining a diagram aloud works so well. Speech forces you to convert a picture into a chain of causes, and every missing link shows up as a hesitation, a vague word, or a full stop.
This article explains why explaining a diagram aloud helps you learn it, including the self-explanation effect, what experiments found when diagrams met speech, why diagrams respond especially well, and how to use the technique on your own material.
What self-explanation actually is
Self-explanation means explaining material to yourself while you study it, out loud or in writing, rather than simply reading it through. The point is not to repeat definitions. It is to say why each step holds.
The effect was first documented by Michelene Chi and colleagues in 1989, in studies of physics students working through worked examples. Students who were prompted to explain why each step was valid developed deeper conceptual understanding than students who only read the steps, even without extra feedback.
Good self-explanations answer "why" and "how" questions.
Why does this arrow point this way and not the other? What would break if this part were removed? What happens next, and why?
Weak self-explanations merely restate labels. Saying "this is the pump" adds nothing. Saying "the pump pushes blood into the arteries, so pressure rises here and falls there" builds a causal chain the brain can reuse.
Why diagrams are different from text
Text already does part of the explaining for you. A paragraph states causes in order, names the actors, and spells out the sequence. Reading it feels like understanding because the author's reasoning is doing the work.
A diagram does the opposite. It lays out the parts and their connections in space, but it leaves the story unstated. The reader must supply the sequence, the direction of cause, and the reason each link exists.
That incompleteness is a strength when you explain aloud. The diagram gives you the structure for free, so your working memory is not spent holding the parts in mind. Your effort goes instead into the one thing the diagram does not supply: the explanation.
Diagrams also make gaps visible. In text, a sentence you do not understand can be skimmed past without noticing. In a diagram, an arrow you cannot explain stares back at you until you deal with it.
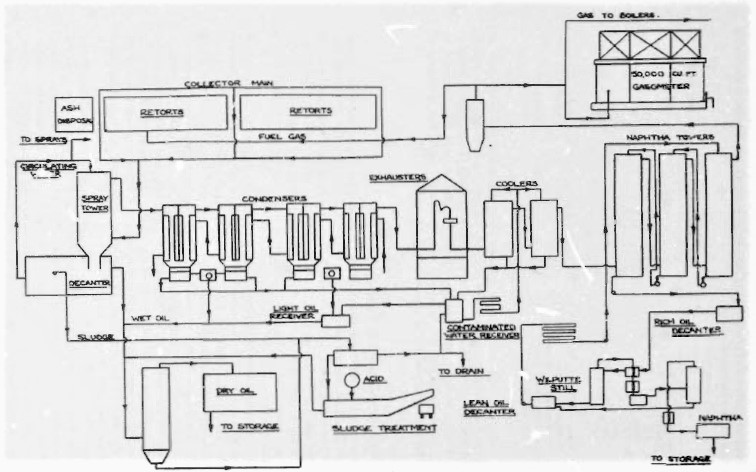
[A flow diagram traces material from retorts through a condensing plant to a naphtha plant.] Photograph: a flow diagram
Image Credits: Wikimedia Commons
What the diagram experiment found
Ainsworth and Loizou tested this directly in a study published in Cognitive Science in 2003. Twenty students learned about the human circulatory system while being prompted to self-explain, with 10 receiving the material as text and 10 as diagrams.
The diagram group performed significantly better on post-tests than the text group. They also generated significantly more self-explanations than the text group, even though the text group spent longer studying the material.
The statistical gap was clear. The format effect on the number of self-explanations was significant at F(1,18) = 6.06, p less than 0.025, while the diagram students spoke fewer words overall than the text students.
In plain terms, diagrams produced more explanations in fewer words. The format did not make students talk more. It made their talk count for more, because each explanation could attach to a visible part of the system.
When the researchers split students into high and low self-explainers, the pattern sharpened. Seven of the 10 diagram students were high self-explainers, compared with only 2 of the 10 text students, a difference confirmed by Fisher's exact test at p less than 0.035.
Why explaining beats redrawing or rewatching
A later experiment tested explaining against two rival strategies. In a study of 196 college students learning about the human kidney from a narrated video lesson, students either wrote verbal explanations, created drawings, or rewatched each part of the lesson.
The explain group significantly outperformed both rivals on retention and transfer tests. Against the draw group, the advantage was d = 0.60 for retention and d = 0.67 for transfer. Against the rewatch group, it was d = 0.58 and d = 0.87.
Explaining was most effective when students had watched diagrams being drawn step by step rather than shown as finished pictures, with transfer effects above d = 1.0 in that condition compared with below d = 0.5 for static visuals.
The lesson is not that drawing is useless. It is that drawing a diagram you already have adds little, while explaining it forces the causal reasoning that tests actually measure.
Why speaking aloud adds something extra
Silent self-explanation can drift. You can think you explained an arrow while only nodding at it, and the illusion of understanding survives because nothing was pinned down.
Speech pins it down. A spoken sentence has a beginning, a middle, and an end, and a gap in the middle is audible. You hear yourself say "and then this goes somewhere" and you know exactly what you do not know.
Speaking also slows you down just enough. The pace of speech gives each link a moment of attention, while silent reading can race across a whole diagram in seconds without engaging any single connection.
There is a social effect too, even when nobody is listening. Explaining to an imagined listener pushes you toward complete sentences and explicit connections, because you instinctively fill in what a listener would need.
How to do it on your own material
Start with one diagram and a blank page, not the textbook. Cover the labels if you can, and try to rebuild the explanation from the shapes alone.
Talk through it part by part, in order. Name each part, say what it does, and say what it connects to and why. If you cannot say why, mark that arrow and look it up before moving on.
Ask yourself three questions at each link. What causes this? What would happen if it stopped?
What comes next? Those three questions turn a tour of the diagram into an explanation of the system.
Keep each pass short. Five focused minutes on one diagram beats half an hour of mumbling through a whole chapter, because attention fades and the later explanations get thinner.
Finish by writing one sentence that summarises the whole system. If you cannot write that sentence, you have found the exact place where your understanding is thinnest, and that is the place to revisit.
When explaining aloud does not help
Explaining a diagram you have never studied is frustrating rather than useful. You need a first pass through the material, even a rough one, before self-explanation has anything to work with.
It also helps less for pure memorisation tasks. If the exam only asks for labels, drilling labels is faster. Explaining pays off when the exam asks why systems behave as they do.
Finally, explaining without checking can entrench mistakes. A confident wrong explanation feels as good as a right one, so check your version against the source after each pass, especially on the arrows you hesitated over.
What is the self-explanation effect?
It is the finding that explaining why each step of material holds, rather than just reading it, deepens understanding. Michelene Chi and colleagues documented it in physics students in 1989.
Do diagrams really beat text for self-explanation?
In Ainsworth and Loizou's 2003 experiment, diagram learners generated more self-explanations and scored higher on post-tests than text learners, despite studying for less time.
Should I explain to someone else or to myself?
Both work, and self-explanation alone is effective. Explaining to a real listener adds pressure to be complete, but a careful solo explanation captures most of the benefit.
How is this different from the Feynman technique?
The Feynman technique is a close cousin: explain a topic simply, find the gaps, and restudy them. Diagram self-explanation applies the same idea to visual material, using the diagram's structure as the scaffold.
What if I cannot explain part of a diagram?
That is the technique working. Mark the exact arrow or label, look it up in your source, and explain it again until the sentence comes out clean.
The bottom line
Explaining a diagram aloud helps you learn it because diagrams show structure without telling the story, and speech forces you to supply that story link by link. Experiments show diagram learners who self-explain outperform text learners and beat redrawing and rewatching, because every spoken sentence either builds a causal chain or exposes a gap in it. Pick one diagram, talk through it part by part, and let the hesitations tell you what to study next.
Tags: self-explanation, diagrams, study techniques, Feynman technique
Rive News's research desk writes evidence-based explainers on study science, drawing on published research and public sources.
Related
- The Feynman technique: why explaining exposes knowledge gaps
- Why teaching someone else helps you learn
- Cognitive load: how cluttered slides hurt student learning
- What is metacognition in learning? A simple explanation
Subscribe to the Rive News newsletter for one study-science explainer each week.
Rive News publishes general educational explainers based on public sources; claims are attributed in the text.
Related stories

Why Do I Blank Out During Tests Despite Studying: Test Anxiety and Retrieval Failure
Blanking out in exams is retrieval failure, not missing knowledge. Anxiety drains working memory; rereading builds false confidence. Here

How to Study for Exams Without Burning Out
Sleep 7-8 hours, study in 25-50 minute blocks, and exercise daily. The science-backed way to study for exams without burning out, and what

Why Do I Forget What I Just Read? Science Has an Answer
You forget what you just read because of the forgetting curve, mapped by Ebbinghaus in 1885. Science explains why memory fades fast and how