
Why students remember diagrams better than paragraphs of text
By Rive News / Research desk | Rive News / Published October 28, 2026 at 9:00 AM PKT
Key takeaways
- Dual coding theory says the brain stores words and images through two connected systems, giving memories two routes back.
- Diagrams show structure, sequence and relationships at a glance, while paragraphs reveal them one word at a time.
- A diagram only helps when it carries meaning; decoration, clutter and copied pictures add little.

A mind map turns a topic into a visible structure instead of a wall of words. Photograph: brainstorming mind map on paper
Image Credits: Pexels
Most students have felt it: a paragraph read three times slips away, while a diagram glanced at once stays. This is not a trick of personal learning style.
It follows from how memory stores information, and from a basic difference between pictures and prose. Diagrams let the brain see a whole structure at once, while text forces it to rebuild that structure word by word.
This article explains why students remember diagrams better than paragraphs, including dual coding theory, the picture superiority effect, and the practical rules that separate useful diagrams from pretty ones.
Two memory systems instead of one
The core explanation comes from Allan Paivio, a Canadian psychologist at the University of Western Ontario. Paivio proposed dual coding theory, which he set out in his 1986 book Mental Representations: A Dual-Coding Approach. The theory holds that human thinking uses two interconnected systems.
One system processes verbal material: words, facts and explanations. The other processes non-verbal material: images, diagrams, maps and mental pictures.
The two systems can work independently, but they also connect. When a learner reads the word "elephant," they process the word and may also form a mental image of an elephant, and the link between the two makes recall easier.
SaveMyExams summarises the practical result in plain terms. Combining images with words creates two memory traces instead of one, making it more likely the learner will remember the content later. In an exam, where recall matters most, two routes back to a fact beat one.
The picture superiority effect
A related finding is the picture superiority effect, the observation that people remember pictures and visual information better than written or spoken words. Research.com, reviewing cognitive theories behind visuals in education, notes that this advantage stems from the large brain regions devoted to visual-spatial processing compared with the smaller areas devoted to text.
The effect has a simple logic. Pictures carry distinctive features such as shape, colour and position, which give memory extra hooks.
A paragraph about the heart offers words alone. A labelled diagram of the heart offers words plus shape, position and flow, all tied together in one image.
This does not mean every picture helps. A decorative image with no link to the content adds hooks to nothing. The picture superiority effect applies to meaningful images that carry the information itself, not to clip art placed beside it.
Seeing structure all at once
Jill Larkin and Herbert Simon gave the second major explanation in a 1987 paper. They compared the time, effort and accuracy involved in understanding concepts presented verbally or visually, and reached what is now called the visual argument. Well-constructed diagrams, they judged, were more computationally efficient than text.
The reason lies in how each format delivers information. Text is sequential: each word arrives one at a time, and the reader must hold earlier words in mind while connecting them to later ones. Sentences that refer back across a paragraph demand searching and reconnecting, which costs mental effort.
Diagrams are synchronous, in Paivio's term. Their parts sit side by side and can be perceived together. A flowchart shows a whole process in one view.
A timeline shows order and spacing at a glance. A comparison table shows similarities and differences without the reader hunting through sentences. As Education Corner explains, diagrams can largely be understood through everyday perception rather than through sentence-by-sentence decoding.
Less load on working memory
John Sweller's cognitive load theory adds a third explanation. Working memory can hold only a few items at once, and poorly organised material wastes that capacity on sorting rather than learning. Well-designed visuals reduce this extraneous load by organising information in ways that match how visual processing works.
A diagram chunks a topic into parts and shows how the parts relate. That chunking is the work a reader of prose must do alone: deciding what matters, grouping ideas, and tracking relationships across paragraphs. When the diagram does that organising visibly, the learner can spend effort on understanding instead.
This is why dual coding guides stress breaking complex topics into manageable parts. Turning a process into a flowchart or a system into a labelled diagram makes the structure explicit. The learner sees the whole before studying the parts, which is the opposite order to reading a dense paragraph cold.
Making a diagram forces real thinking
Drawing a diagram also helps because making one is active work. A student who copies a paragraph can stay passive. A student who turns that paragraph into a diagram must decide what matters, what connects to what, and what to leave out.
Goodoff, a study-technique guide, puts the point sharply: dual coding means not just reading about the water cycle, but sketching the cycle, labelling the stages and explaining each stage in a sentence. The words and the picture reinforce each other. The student is not decorating notes; they are building a second representation of the same concept.
That decision-making is what psychologists call deeper processing. Choosing a shape for a concept, an arrow for a cause and a branch for an example forces the learner to think about meaning. That thinking is itself a memory aid, separate from the finished diagram.
When diagrams fail
Diagrams fail when they carry no meaning. A stock photo beside a definition, a mind map copied from a textbook without understanding it, and a slide crammed with tiny text all waste the visual channel. The image must show relationships, sequence, structure or comparison to earn its place.
Clutter is the other failure. A diagram with too many colours, boxes and arrows creates its own load, and the learner spends effort decoding the diagram instead of the topic. Simplicity wins: a few clear elements, short labels, and one idea per diagram.
Accuracy matters too. A wrong arrow teaches a wrong relationship faster than a wrong sentence does, because the picture feels authoritative. Students should check each diagram against their notes or textbook before trusting it in revision.
Diagrams by subject
Different subjects reward different diagram types. Science processes suit flowcharts, where each step leads visibly to the next. Respiration, digestion and the water cycle all read better as sequences than as paragraphs.
History suits timelines and maps. A timeline shows causes and effects in order, while a map shows where events happened and why location mattered. Literature suits character maps, with a sketch of a character surrounded by key traits and quotes, as SaveMyExams suggests.
Maths suits graphs and geometric sketches, which make abstract relationships concrete. A graph shows a trend that a table of numbers hides. In each case, the diagram type should match the kind of relationship being learned: sequence, structure, comparison or change over time.
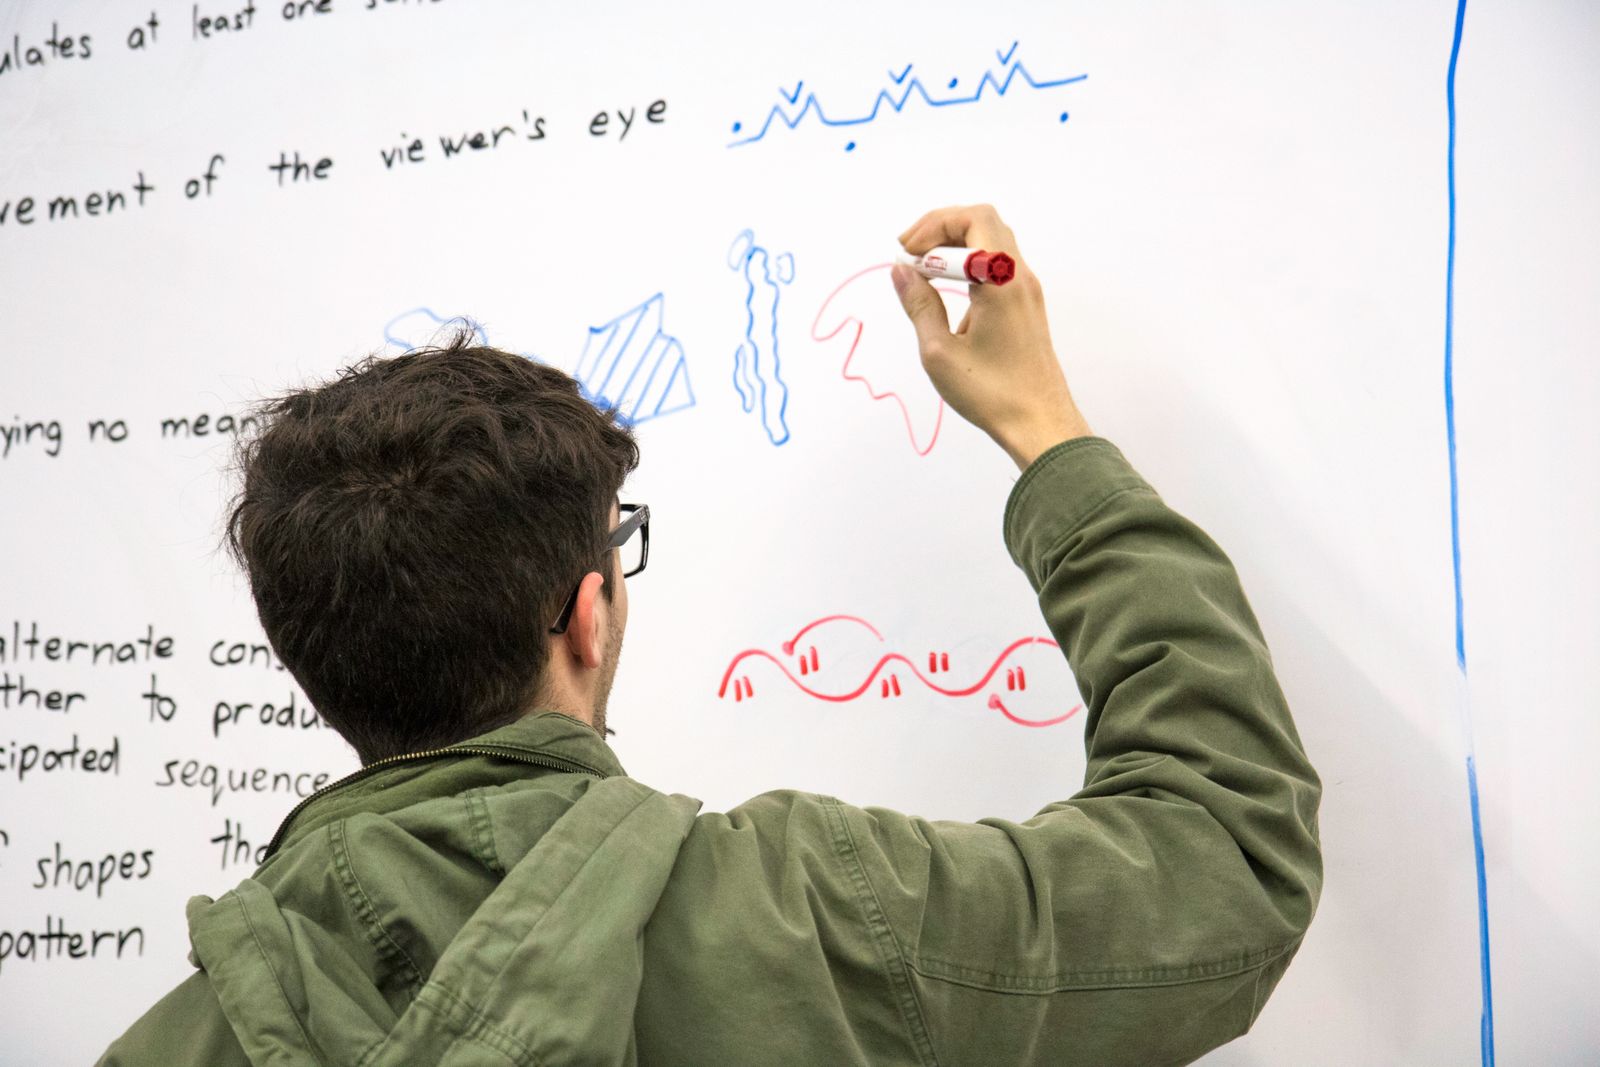
Drawing the diagram yourself forces choices about what matters and how ideas connect. Photograph: student drawing diagrams on a whiteboard
Image Credits: Pexels
How to turn a paragraph into a diagram
Start by reading the paragraph once and naming its core idea in a few words. That core idea becomes the centre of a mind map, the title of a flowchart, or the main label of a sketch. Everything else in the paragraph becomes a branch, a step or a part.
Next, ask what kind of relationship the paragraph describes. A sequence becomes a flowchart. A system with parts becomes a labelled diagram.
A comparison becomes a table or a two-column sketch. An argument becomes a chain of boxes linked by arrows.
Then draw it quickly and label it in short phrases, not sentences. Rough sketches work as well as neat ones, since the benefit comes from the thinking and the dual trace, not from artistic quality.
Finally, cover the paragraph and explain the diagram aloud from memory. Gaps in that explanation show what the diagram still needs.
Pairing diagrams with words
Diagrams work best with words, not instead of them. A diagram without labels is a puzzle, and a diagram without an explanation is easy to misread. The strongest revision pairs each diagram with a short written summary, ideally written from memory rather than copied.
This pairing is the heart of dual coding. The verbal system holds the explanation, the visual system holds the structure, and the links between them give recall two paths. Students who revise from diagrams alone, or from text alone, use only half the system Paivio described.
A good test of a revision diagram is simple. Show it to someone unfamiliar with the topic and ask what it means.
If they can follow the structure and the labels, the diagram carries real meaning. If they cannot, it needs clearer labels or fewer elements.
Frequently asked questions
Do I need to be good at drawing for diagrams to help?
No. Simple shapes, arrows and stick figures work fine. The benefit comes from organising ideas visually, not from artistic skill.
Is a mind map better than a flowchart?
Neither is better in general. Mind maps suit topics with a central idea and branches, while flowcharts suit sequences and processes. Match the diagram to the relationship.
Should I replace all my notes with diagrams?
No. Diagrams pair with short written summaries. Words carry definitions and detail, while diagrams carry structure and relationships.
Why do copied diagrams not help as much?
Copying skips the decisions that make diagrams useful. Drawing your own forces you to choose what matters and how ideas connect, which is itself a memory aid.
Can diagrams hurt revision?
Yes, when they are cluttered, decorative or inaccurate. Keep each diagram simple, meaningful and checked against reliable notes.
The bottom line
Students remember diagrams better than paragraphs because diagrams use both memory systems, show structure at a glance, and cut the load of rebuilding that structure from sentences. Paivio's dual coding theory and Larkin and Simon's visual argument explain the effect, and the practical rules follow from them: draw your own diagrams, keep them simple, label them briefly, and pair them with words.
The next time a paragraph refuses to stick, stop re-reading it. Turn it into a diagram, explain the diagram aloud, and let the picture carry what the prose could not.
Tags: diagrams, dual coding, memory
The Rive News research desk covers work, study and everyday science topics from published sources, with no invented experts or statistics.
Related
- What desirable difficulty means in learning
- How cluttered slides hurt student learning
- Why practice tests beat rereading every time
- How to take notes that you will actually remember
Subscribe to the Rive News newsletter for one research-backed explainer each weekday.
Rive News articles cite public sources for key claims and correct errors when readers point them out.
Related stories

Why Do I Blank Out During Tests Despite Studying: Test Anxiety and Retrieval Failure
Blanking out in exams is retrieval failure, not missing knowledge. Anxiety drains working memory; rereading builds false confidence. Here

How to Study for Exams Without Burning Out
Sleep 7-8 hours, study in 25-50 minute blocks, and exercise daily. The science-backed way to study for exams without burning out, and what
Why Do I Forget What I Just Read? Science Has an Answer
You forget what you just read because of the forgetting curve, mapped by Ebbinghaus in 1885. Science explains why memory fades fast and how