
How to read a trail map and topographic lines
Key takeaways
- Each contour line connects points of equal elevation (height above sea level), so walking along one line means never climbing or descending.
- The contour interval, printed in the map margin, tells you the elevation change between adjacent lines; multiply by the lines you cross to estimate climb.
- Tight lines mean steep ground, wide lines mean gentle ground, and V-shaped bends pointing uphill mark stream valleys.
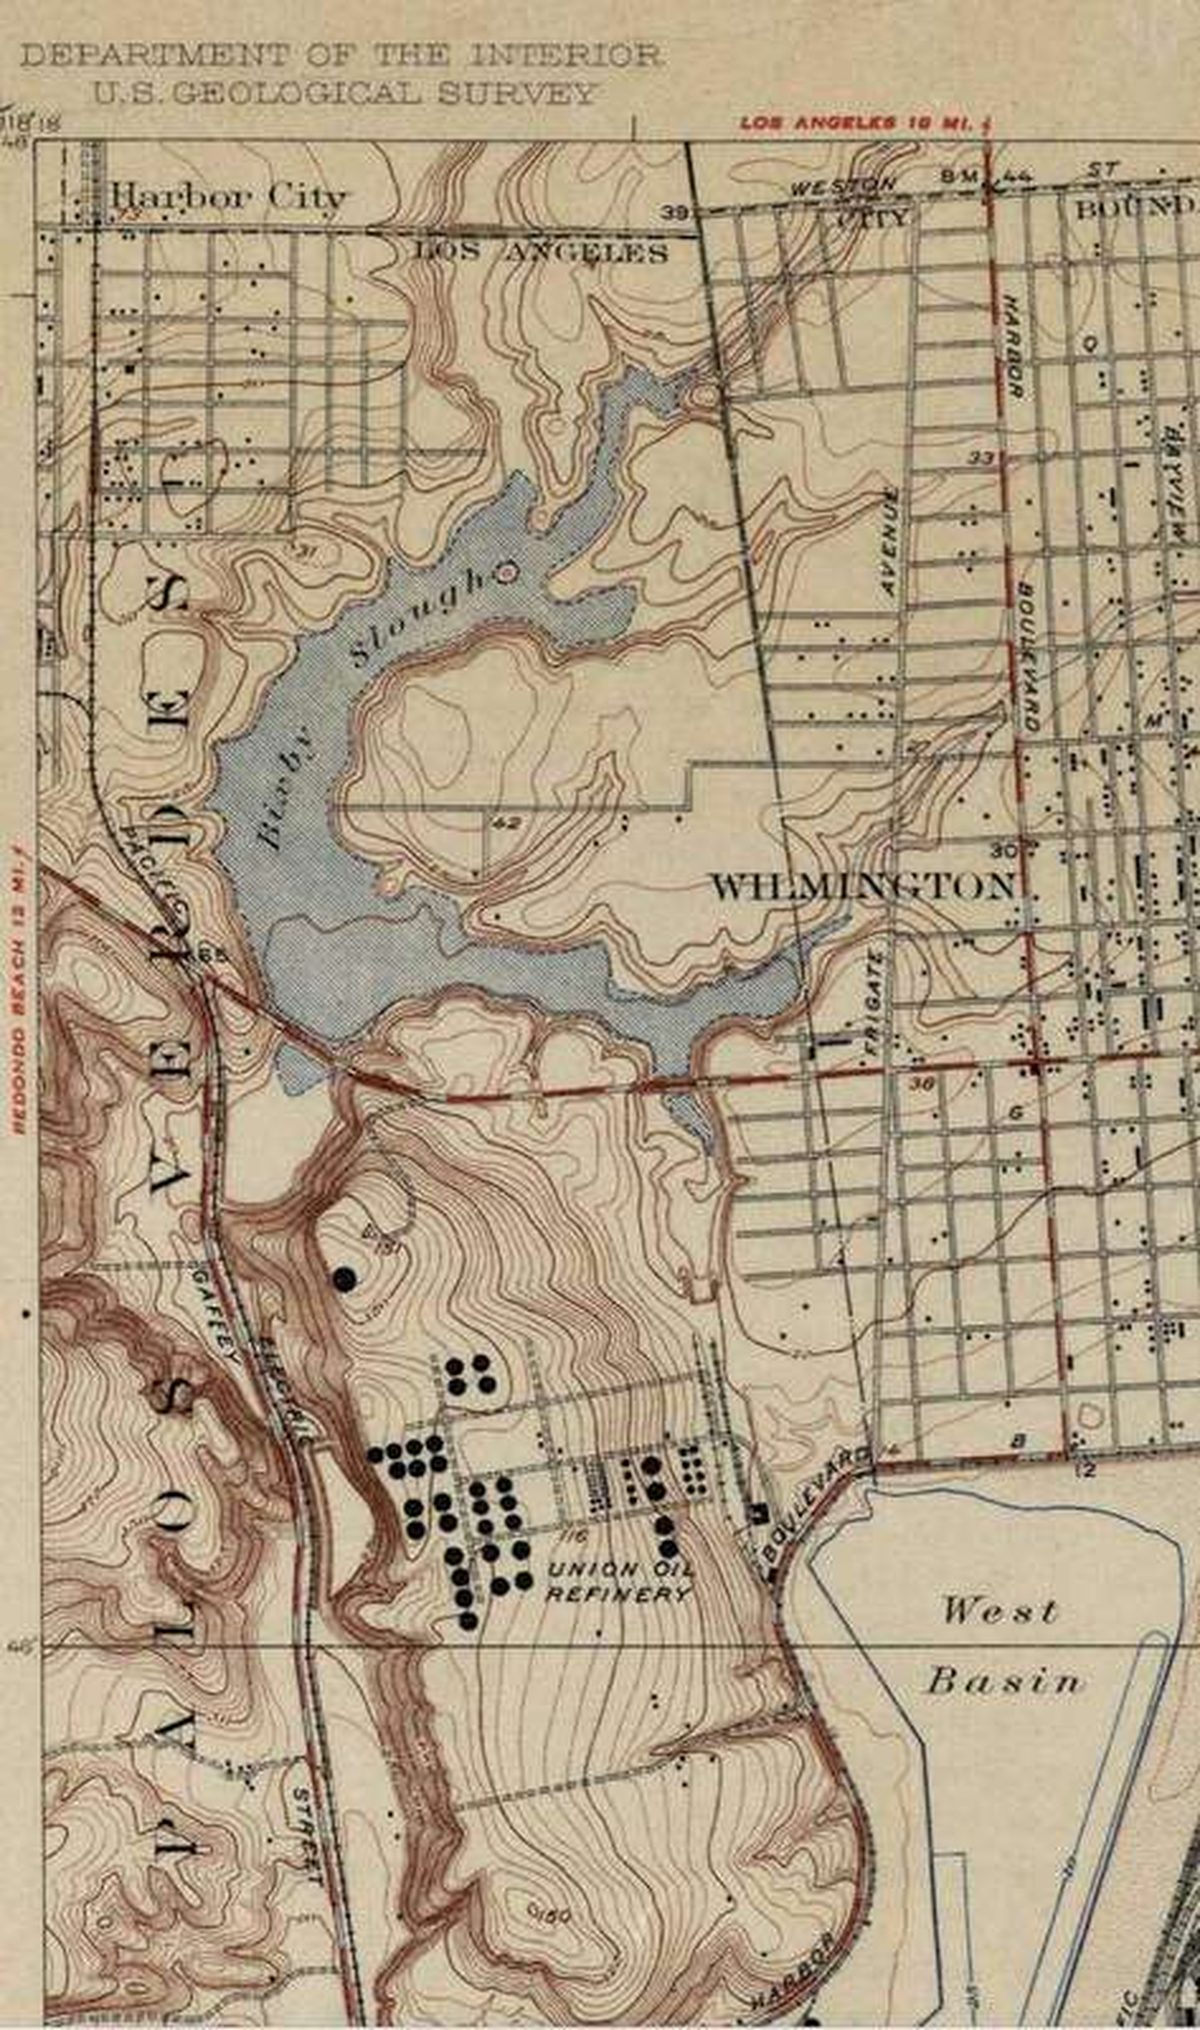
A 1924 U.S. Geological Survey topographic map of the Los Angeles area, showing the classic brown contour lines that reveal hills, valleys, and slopes. Photograph: US Geological Survey, USGS Topo map 1924/Wikimedia Commons.
Image Credits: Wikimedia Commons
A trail map without contour lines is just a drawing of where the path goes. A trail map with contour lines is a three-dimensional model of the terrain pressed flat. Those brown squiggles are the difference between knowing a trail is "about 6 miles" and knowing it climbs 1,800 feet in the first two of them.
Learning to read them is a practical skill, not an academic one. It tells you which route is the gentle one, where the view will be, and whether that innocent-looking loop hides a brutal climb. Hikers who read contours plan better days.
This article explains how to read a trail map and topographic lines, including what contour lines show, how to use the contour interval, what line spacing says about steepness, how to read hills and valleys from the shapes, and how to put it all together on a real route.
What contour lines actually show
A contour line connects every point at the same elevation. The U.S. Geological Survey defines the topographic map's key feature exactly this way: contour lines portray the shape and elevation of the land, rendering the three-dimensional ups and downs of terrain on a two-dimensional surface.
The clearest mental model comes from HowStuffWorks, via MapQuest's guide. Imagine shining a laser pointer horizontally along the side of a pile of laundry. The glowing line where the beam hits is a contour line.
Walk along that imaginary line in the real world and your elevation never changes. Step off it and you are going up or down.
On USGS maps, contours are printed in brown. That color coding is standard: brown for elevation, blue for water, green for vegetation. When you glance at a topo map and see the brown web over everything, you are looking at the skeleton of the landscape.
One rule never breaks: contours never cross. A single point on the ground cannot be at two elevations at once. If two lines appear to touch, you are looking at a vertical cliff, where the horizontal distance between elevations is effectively zero.
Reading the contour interval first
The contour interval is the elevation change between two adjacent lines, and it is constant across the whole map. Before you read a single squiggle, find this number in the map margin. Everything you estimate starts from it.
On USGS maps, common intervals are 1, 5, 10, 20, 40, and 80 feet, according to the land-navigation references. Flat country gets small intervals of 10 feet or less; mountainous maps may use 100 feet or more. The interval is chosen so the map stays readable: too many lines in steep country would turn into an unreadable brown blur.
Once you know the interval, elevation becomes arithmetic (simple math). Find a labeled line, count the lines to your point, and multiply.
With a 20-foot interval, crossing five lines uphill from the 700-foot line puts you at 800 feet. That is all there is to it.
Pay attention to the units too. Most USGS maps use feet, but some use meters, and mixing them up will wreck your estimate. The margin tells you which, so check before you trust any comparison with your phone's GPS.
What line spacing tells you about steepness
This is the single most useful reading skill on a topo map. Where contour lines crowd tightly together, the slope is steep: a lot of elevation changes over a short horizontal distance. Where they spread wide apart, the ground is gentle or flat.
Think of it as a side view of a hill. A cliff face rises fast, so each elevation line sits almost on top of the next.
A rolling meadow rises slowly, so the lines have room to breathe. The map is giving you the hill's profile from above.
Use this to plan routes before your boots touch dirt. A trail that crosses many tightly packed lines is a climb; the same distance crossing few lines is a stroll. When choosing between two routes to the same lake, the spacing comparison is faster and more reliable than any trail description.
Our guide to hiking trail difficulty ratings pairs well with this, since ratings describe the trail while contours describe the ground.
Also watch for lines that merge or nearly touch. That is a cliff or very steep bluff, and on some routes it marks a spot to avoid, especially with a heavy pack or in wet conditions.
Index contours and elevation labels
Counting dozens of thin lines is tedious, so maps help you out. Every fifth contour line is printed darker and thicker, and it usually carries its elevation number right on the line. These are the index contours, and they are your landmarks for quick reading.
The four thinner lines between two index contours are the intermediate contours. With a 20-foot interval, the index lines sit 100 feet apart, and each thin line between them is another 20 feet. You rarely need to count past the nearest index line.
Elevation numbers are printed in several places along the index lines, oriented so they read uphill. A small but handy convention: the top of the digits points toward higher ground. If you are ever unsure which way is up on an unlabeled section, that trick orients you.
Some maps add dashed supplementary contours in very gentle terrain, where the standard interval would leave the landform invisible. Treat them like normal contours for reading shapes, but check the margin for their exact value.
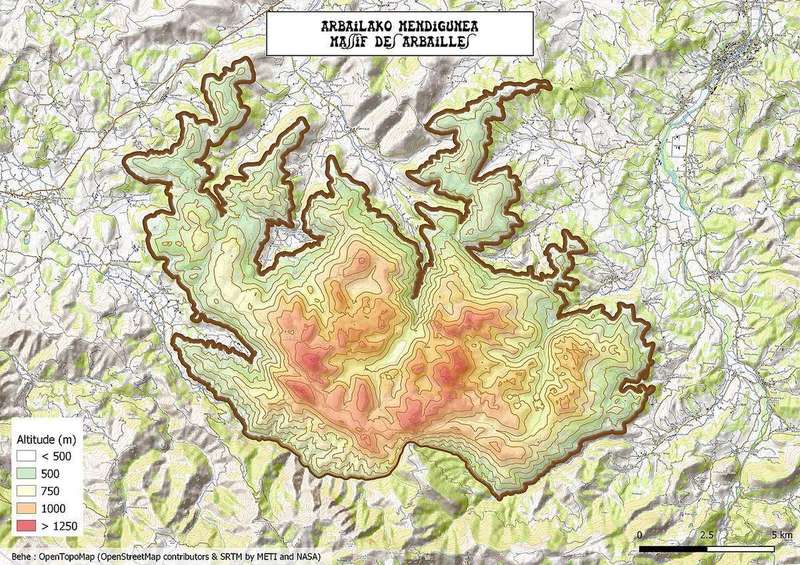
A modern topographic map of the Massif des Arbailles in France, with altitude shading from green lowlands to red high ground. The tight rings at the center mark the steepest peaks. Photograph: Florent Beck/Wikimedia Commons
Image Credits: Wikimedia Commons
Reading hills, valleys, and ridges from the shapes
Contours draw landforms in a small visual vocabulary, and each shape means something specific. Concentric closed circles are hilltops or dips. The innermost ring is the highest (or lowest) point, and TopoStreets' USGS guide uses these bullseye patterns as the first pattern to learn.
Hills and dips look identical as bare rings, so maps mark dips with short tick marks, called hachures, on the inside of the rings. No ticks means a hill. If you see ticked rings on your route, you are looking at a pit or sinkhole, not a summit.
Valleys and ridges are both V-shaped, and the Vs tell you which is which. Where contour lines cross a stream valley, they bend into a V that points uphill, toward higher elevation.
Where they cross a ridge, the V points downhill. Remember it as: Vs point upstream in valleys.
This matters on the trail because water and ridges shape everything. Valleys hold streams, mud, and the wettest crossings; ridges hold the views, the wind, and often the driest walking. Reading the Vs lets you predict the character of the ground ahead, not just its steepness.
Saddles, the low dip between two hilltops, show as an hourglass pinch where two sets of rings nearly touch. Passes and cols are saddles, and trails love them because they are the lowest-energy way over a ridge. Spotting saddles on the map is spotting the natural route.
Putting it together on a real trail
Here is the workflow. First, find the contour interval in the margin and note the units.
Second, locate the index contours near your route and read their elevations. Third, trace your trail and count the lines it crosses, multiplying by the interval for total elevation gain.
Fourth, scan the spacing along the route and mark the tight sections; those are your climbs, and they deserve your time budget and water planning. A route that gains 1,500 feet evenly over six miles is a different day from one that gains it all in the first mile.
Fifth, read the shapes. Vs pointing uphill along your path mean stream crossings, which can matter after rain.
A saddle ahead means a pass with a view. Closed rings off to the side mean a summit worth the detour.
Finally, sanity-check the map against reality as you walk. Match a stream crossing, a saddle, or a distinctive bend in the trail to the map, and confirm your position.
If you do get turned around, our lost-hiker stop protocol covers what to do next.
And the blister prevention guide will save your feet on the climbs you just learned to spot.
One more number worth knowing: the classic USGS hiking map is the 7.5-minute quadrangle at 1:24,000 scale, a standard since 1947. At that scale, one inch on the map equals 2,000 feet on the ground, according to the USGS.
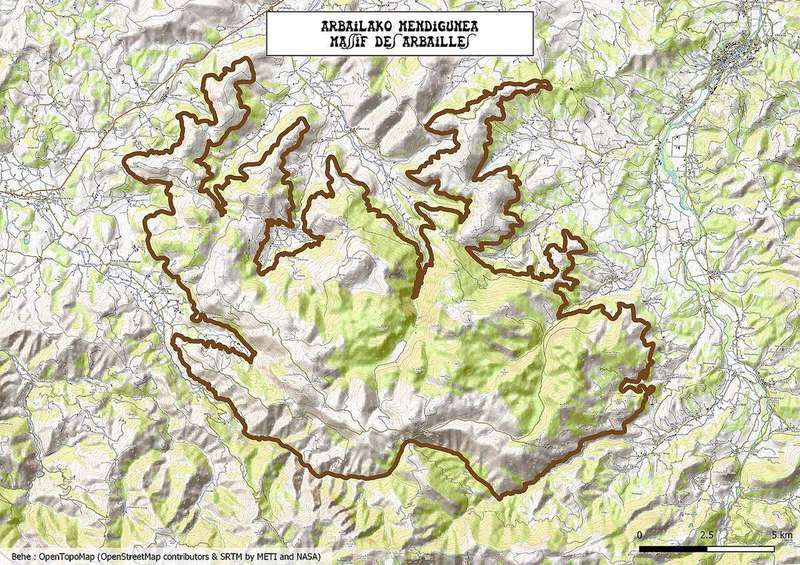
A topographic map of the Massif des Arbailles with a marked boundary, built on OpenTopoMap data. Modern digital topos layer the same contour logic over satellite imagery. Photograph: Florent Beck/Wikimedia Commons
Image Credits: Wikimedia Commons
Frequently asked questions
What does the contour interval tell me?
It is the vertical distance between adjacent contour lines, constant across the map and printed in the margin. Multiply the number of lines you cross by the interval to estimate elevation gain or loss along a route.
How can I tell if a hill is steep or gentle on a topo map?
Look at the spacing. Tightly packed contour lines mean steep ground; widely spaced lines mean gentle slopes or flat terrain. Lines that merge indicate a cliff.
What is the difference between index and intermediate contours?
Every fifth line is an index contour: darker, thicker, and labeled with its elevation. The thinner lines between them are intermediate contours. Index lines let you read elevation at a glance without counting every line.
Why are contour lines brown on USGS maps?
Brown is the standard color for elevation features on USGS topographic maps. Water features are blue and vegetation is green, so the brown web of contours reads as the land's shape at a glance.
The bottom line
Contour lines are elevation made visible. Find the interval, read the spacing for steepness, use index lines for quick elevation, and let the Vs and rings tell you where the valleys, ridges, and summits are.
Practice on a familiar hill first, where you can check the map against ground you know. Once the brown squiggles start reading as terrain, every trail map becomes a preview of the day ahead.
Rive News is the research desk behind the Rive News production run, writing practical explainers across gardening, careers, education, and more.
Latest in sports
- How hiking trail difficulty ratings work
- Why you get blisters when hiking and how to prevent them
- The lost-hiker stop protocol
Get one practical explainer in your inbox every morning. Subscribe to the Rive News newsletter.
Corrections: spotted an error in this article? Email the research desk and we will verify and fix it promptly.
Related stories
Why Is Altitude Sickness Worse for Some People?
Altitude sickness hits some people harder because of genetics, ascent speed, and prior history, not fitness level. Here is what raises risk
Why Do You Get Blisters When Hiking and How to Prevent Them
Friction plus moisture plus heat equals a blister. Learn why hiking breeds all three, and the boots, socks, and tape system that keeps
How to choose hiking boots for beginners: fit, features, and break-in
Beginners should buy for fit first: snug everywhere, tight nowhere, with a thumb's width at the toes. Here is how to size, test,